Overview
This project uses Python to perform a raster-based suitability analysis to identify optimal locations for a maple tree farm in British Columbia. Environmental criteria including elevation, road proximity, canopy height, area quality, hydrolines, cutblocks, MKRF bounds, and MGVI were applied as binary masks to input rasters and combined into a final suitability layer. Results were visualized as a multi-panel plot and overlaid transparently on a true-colour SPOT satellite image.
Objectives
- Read, process, and write raster data using
rasterioandnumpy - Apply environmental suitability criteria as binary raster masks
- Combine multiple criteria layers into a single output suitability raster
- Visualize input rasters, the final suitability layer, and an overlay on satellite imagery
Data Sources & Tools
| File | Description |
|---|---|
dem.tif | Digital Elevation Model of the study area |
RoadsBuff.tif | Raster buffer layer around road network |
Spot_data.tif | True-colour SPOT satellite imagery |
| Library | Purpose |
|---|---|
rasterio | Reading, writing, and displaying raster data |
numpy | Array operations and binary mask creation |
matplotlib | Multi-panel plotting and visualization |
Methods
Each input raster was read using rasterio and evaluated against suitability thresholds to produce a binary mask (1 = suitable, 0 = not suitable). Criteria included elevation between 300–700 m, proximity to roads, canopy height, area quality, hydrolines, cutblocks, MKRF bounds, and MGVI. Binary masks were combined using logical AND operations to produce a final suitability raster. The output was cast to uint8, saved as a GeoTiff, and visualized in three ways: a multi-panel plot of all input masks, a standalone binary suitability map, and a transparent overlay on the SPOT true-colour image.
Outputs
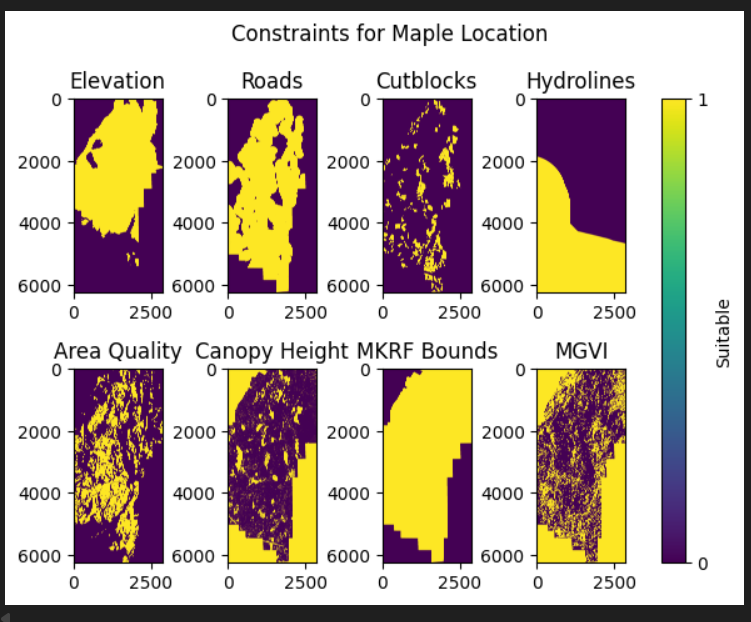
Multi-panel plot showing each input raster after applying suitability criteria — yellow = suitable, purple = not suitable
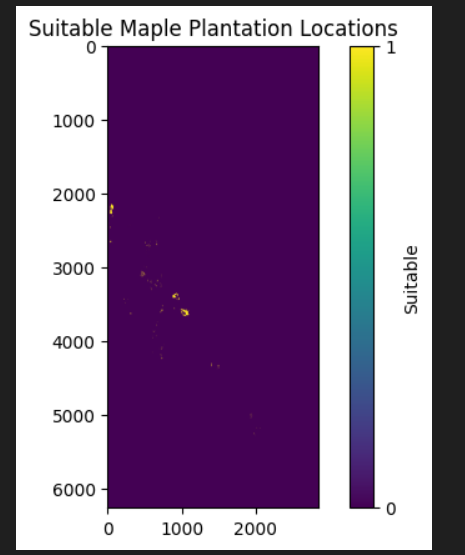
Final binary suitability map showing locations meeting all combined criteria
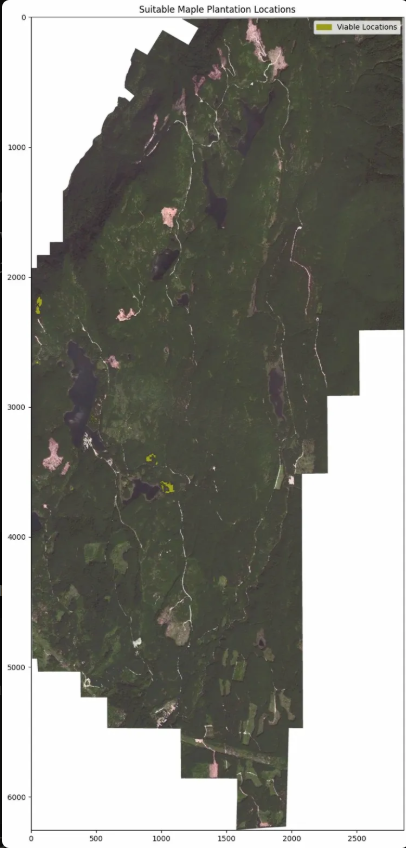
Suitable maple plantation locations (yellow) overlaid transparently on SPOT true-colour satellite imagery
Key Findings
- Suitable maple farm locations were constrained to areas within the 300–700 m elevation range and within the road buffer zone
- Binary masking allowed multiple environmental criteria to be combined efficiently using numpy array operations
- The SPOT overlay clearly showed that suitable areas align with accessible, lower-relief forested land
Skills Learned
- Reading and writing raster data with
rasterio - Accessing and interpreting raster metadata (profile, CRS, dimensions)
- Creating binary masks from raster arrays using
numpycomparison operators - Combining multiple binary masks using logical AND operations
- Casting array data types and updating raster profiles for export
- Creating multi-panel plots with
matplotlib - Overlaying masked raster data transparently on satellite imagery using
rasterio.plot.show