Overview
This project performs two complementary time series analyses in R. The first uses MODIS NDVI data (MOD13Q1) over Yellowhead Country, Alberta to detect vegetation change breakpoints using the BFAST algorithm. The second analyses a 33-year Landsat-derived land cover time series near Williams Lake, BC to quantify annual forest gain, loss, and net change between 1984 and 2016.
Objectives
- Process and summarize a 20-year MODIS NDVI time series
- Extract and analyse NDVI at two regions of interest
- Apply the BFAST change detection algorithm to identify vegetation disturbance events
- Reclassify a multi-class land cover time series into binary forested/non-forested categories
- Quantify annual forest gain and loss in hectares using lagged raster differencing
- Visualize temporal trends using
ggplot2
Data Sources & Tools
| File | Description |
|---|---|
MOD13Q1_TS/ | 460-layer MODIS NDVI time series (2001–2020), 250 m resolution, 16-day composites |
roi_MOD13Q1.shp | Two point regions of interest (ROI A and ROI B) in Yellowhead Country, Alberta |
VLCE_TS/ | 33-layer VLCE land cover time series (1984–2016), 30 m resolution, near Williams Lake, BC |
lc_reclassification.csv | Lookup table for reclassifying VLCE land cover classes to binary forested/non-forested |
| Package | Purpose |
|---|---|
terra | Reading, processing, and analysing raster time series |
sf | Reading and handling vector ROI data |
bfast | Break detection in NDVI time series (bfastmonitor) |
dplyr, tidyr | Data wrangling and reshaping |
lubridate, stringr | Date parsing and string extraction from filenames |
ggplot2 | Time series and bar chart visualization |
readr | Reading CSV files |
Methods
MODIS NDVI filenames were parsed to extract Julian dates, converted to R Date objects, and loaded as a SpatRaster. Median NDVI was calculated per pixel across the full time series. NDVI was extracted at two ROIs and filtered to May–September for monthly summary. The BFAST monitor algorithm was applied to both ROIs using stable history periods to detect deviations from expected seasonal NDVI patterns. For the land cover analysis, 33 annual VLCE rasters were loaded and reclassified to binary forested/non-forested using a lookup table. Lagged raster differencing identified annual gain (+1) and loss (−1) pixels, which were converted to hectares and summarized into a forest_change data frame. Results were visualized as a net change line plot and a stacked gain/loss bar chart.
Outputs
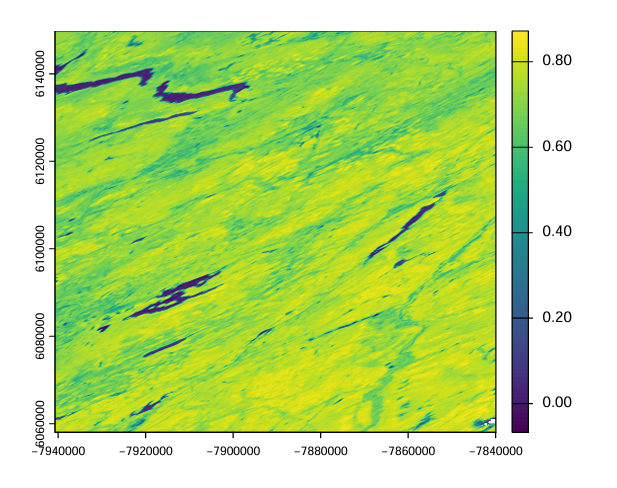
Median NDVI raster map over Yellowhead Country, Alberta (2001–2020)
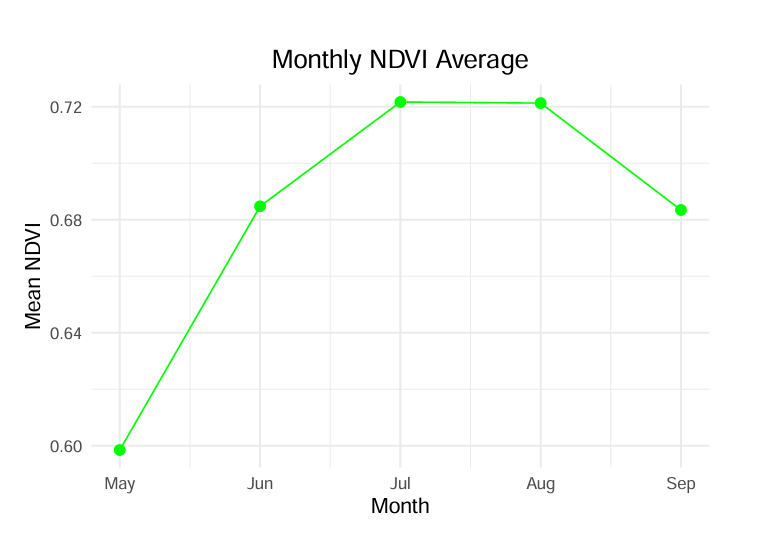
Connected scatter plot of monthly mean NDVI (May–September) averaged across both ROIs for 2001–2006
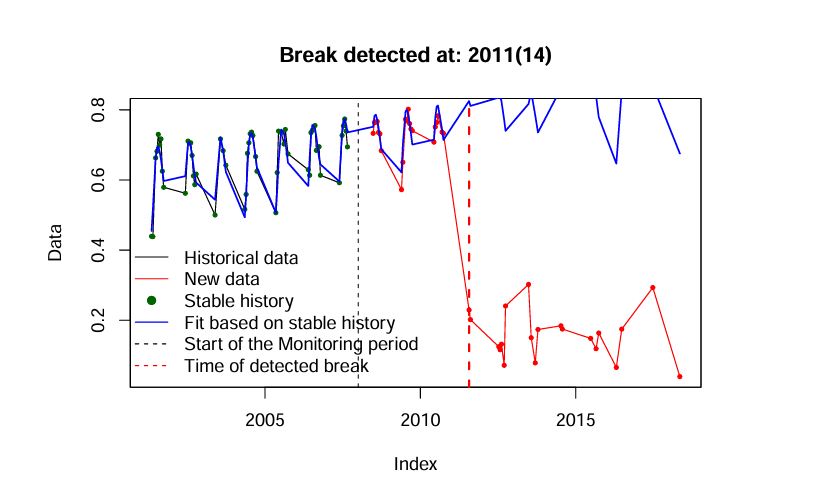
BFAST monitor output for ROI A — break detected at 2011, consistent with a stand-level disturbance
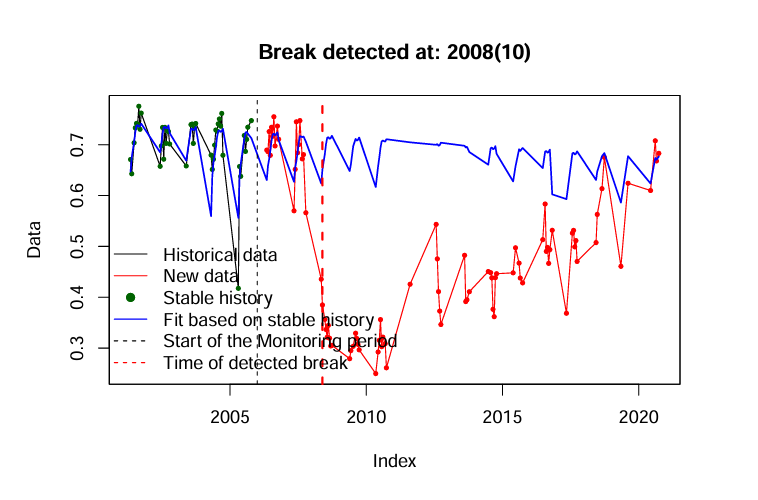
BFAST monitor output for ROI B — break detected at 2008, consistent with vegetation recovery
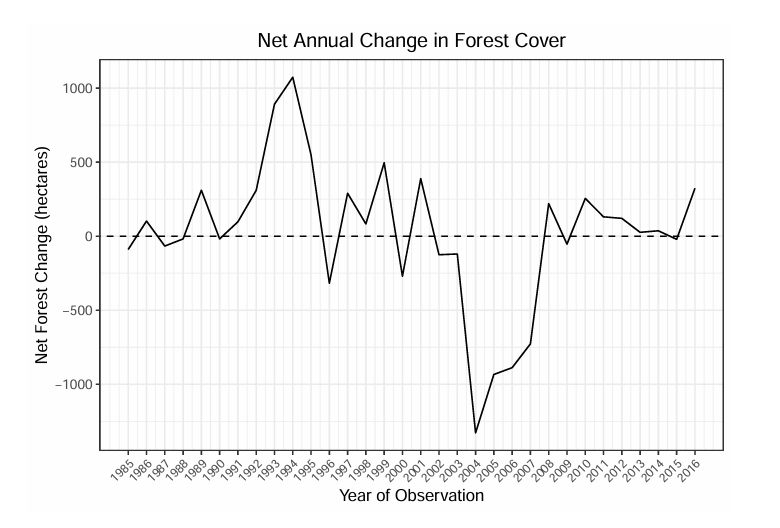
Net annual forest change line plot showing gain and loss trends near Williams Lake, BC (1985–2016)
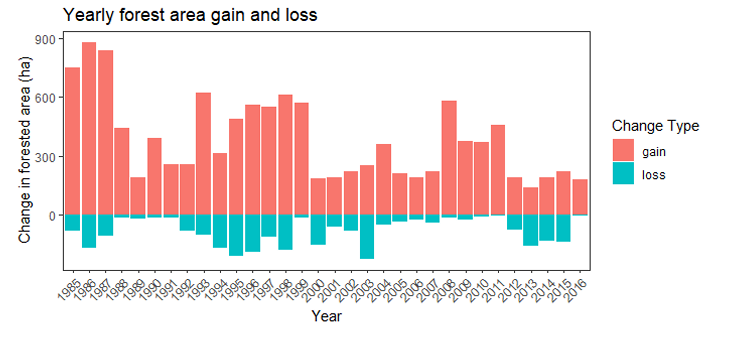
Annual forest gain and loss bar chart (1985–2016) showing stacked gain and loss in hectares
Key Findings
- July had the highest average NDVI across both ROIs for the 2001–2006 period
- BFAST detected an NDVI decrease at ROI A in 2011, consistent with a stand-level disturbance such as clearcutting
- BFAST detected an NDVI increase at ROI B in 2008, consistent with vegetation recovery after a prior disturbance
- Coniferous forest showed the largest decline in the Williams Lake area between 1984 and 2016, replaced primarily by herbs and shrubland
- Forest loss peaked around 2004–2006, likely reflecting a period of intensive harvesting activity
Skills Learned
- Parsing dates from raster filenames using
stringrandlubridate - Loading and naming multi-layer raster time series with
terra - Extracting raster values at point locations using
terra::extract - Reshaping data between wide and long formats using
tidyr::pivot_longer - Filtering and summarizing time series data with
dplyr - Converting NDVI data to
tsobjects and applying BFAST change detection - Reclassifying rasters using a lookup matrix with
terra::classify - Computing lagged raster differences with
terra::diff - Calculating pixel counts and converting to area in hectares using
terra::global - Producing publication-quality time series plots with
ggplot2