Overview
This project defines riparian reserve and management zones within a topographically complex forested watershed in the Nahmint Valley, British Columbia, using a high-resolution Digital Elevation Model (DEM). Stream networks were derived and characterized by order, gradient, and width. BC government stream classification guidelines were applied to assign buffer distances for Riparian Management Areas (RMAs), and watersheds were delineated to assess how forest harvesting runoff could impact stream networks.
Objectives
- Derive and classify a stream network from a DEM using hydrology tools
- Extract stream characteristics including gradient and width by stream order
- Assign BC stream classes and calculate riparian reserve and management zone buffers
- Delineate watershed catchments and generate contour lines
- Evaluate the adequacy of mapped RMAs for stream protection
Data Sources & Tools
| Layer | Description | Source |
|---|---|---|
nahmint_dem | High-resolution DEM of the Nahmint watershed, BC | UBC PostgreSQL Server |
| ArcGIS satellite basemap | Used for visual stream width measurement | ESRI |
| Tool | Purpose |
|---|---|
| QGIS | Exporting the DEM from PostGIS to GeoTiff |
| ArcGIS Pro (Spatial Analyst) | Hydrology analysis, reclassification, zonal statistics, buffering |
| Python (ArcGIS Field Calculator) | Conditional field calculations for stream class and buffer distances |
Methods
The Nahmint DEM was preprocessed by filling sinks and computing flow direction and flow accumulation. A flow accumulation threshold was selected to define the stream network, which was then ordered using the Strahler method and converted to polyline features. Stream gradient was calculated per segment using elevation change and segment length from a zonal statistics workflow. Stream widths were measured manually from the satellite basemap for each stream order and averaged. BC stream classes (S2–S6) were assigned using Python expressions combining gradient and width thresholds, and reserve and management zone buffer distances were calculated accordingly. Watersheds were delineated using the flow direction and stream link rasters, and contour lines were generated to support terrain interpretation.
Outputs
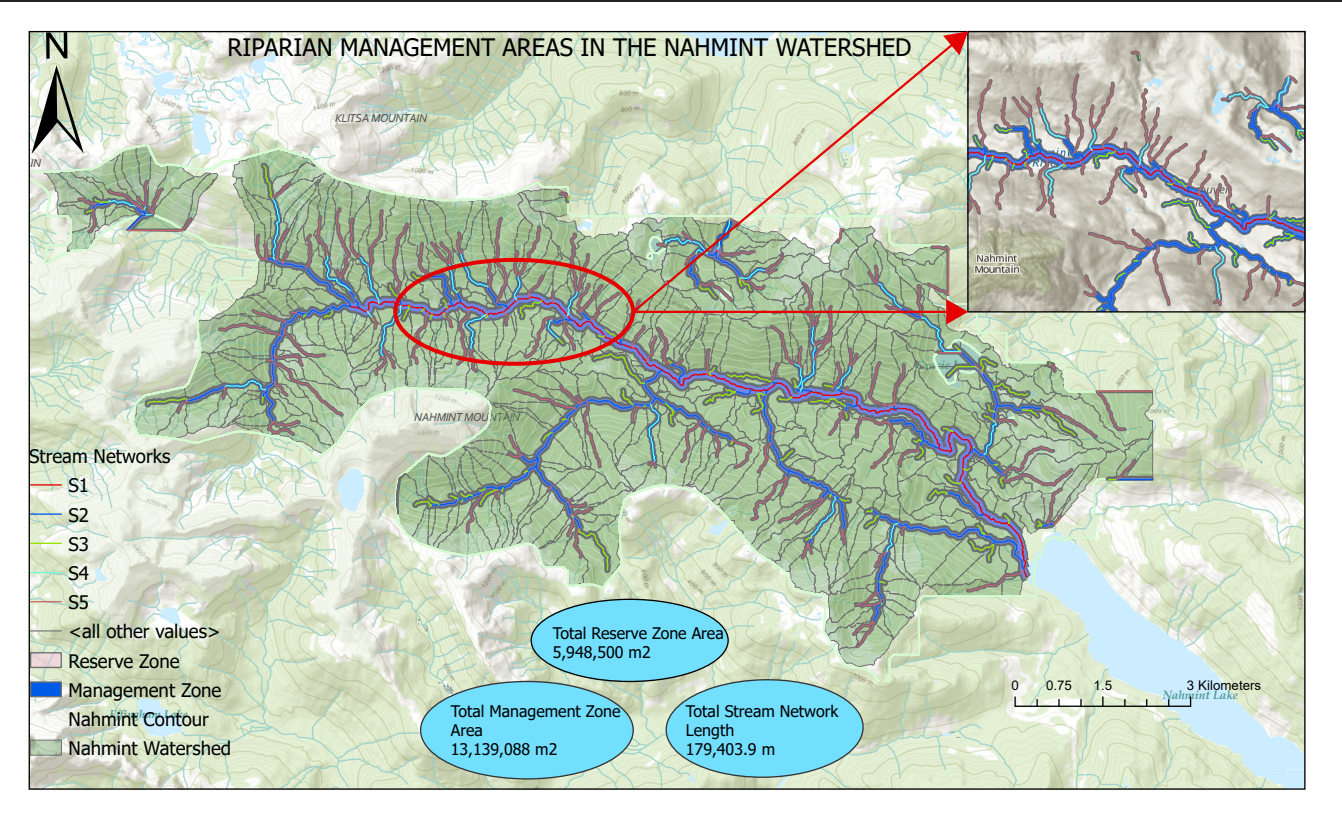
Map showing watersheds, contour lines, stream network symbolized by stream class, an inset map of example RMAs, and total reserve/management zone area and stream network length
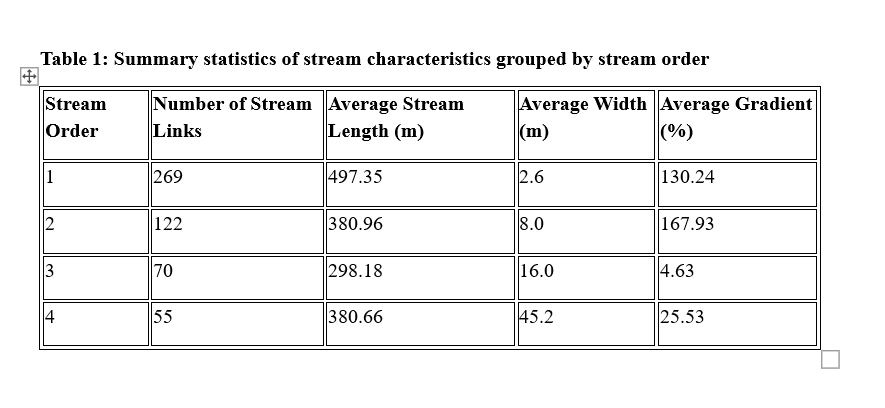
Summary statistics of stream links, average length, width, and percent gradient grouped by stream order
Key Findings
- Stream gradient and width increased with stream order, corresponding to broader and lower-gradient channels in higher-order streams
- Riparian reserve and management zones covered a significant portion of the study area, particularly around higher-order fish-bearing streams
- Watershed delineation highlighted areas where upslope harvesting activity could channel runoff directly into sensitive stream reaches
Skills Learned
- Preprocessing a DEM by filling sinks for hydrological analysis
- Deriving flow direction, flow accumulation, and stream networks from a DEM
- Classifying streams using Strahler stream ordering
- Extracting stream gradient using zonal statistics and field calculations
- Measuring and averaging stream width from a satellite basemap
- Assigning BC stream classes using Python conditional expressions in ArcGIS
- Calculating riparian reserve and management zone buffer distances
- Delineating watershed catchments using the Watershed tool
- Generating contour lines for terrain visualization