Overview
This project models Pacific salmon spawning habitat across Vancouver Island, British Columbia, using hydrological analysis and network tracing in ArcGIS Pro. A stream network was derived from a Digital Elevation Model (DEM), dams were modelled as barriers, and linear referencing was used to characterize stream segments by slope gradient and stream order. The network was then traced from the ocean to identify which stream segments are accessible to salmon and which are blocked by dams, with results filtered against basic habitat requirements.
Objectives
- Derive a stream network from a DEM using flow direction and flow accumulation
- Model dams as network barriers using topology
- Identify ocean entry points for salmon using boundary intersection
- Characterize stream segments by gradient and stream order using linear referencing
- Trace accessible and inaccessible salmon habitat through the network
Data Sources & Tools
| Layer | Description | Source |
|---|---|---|
vancouver_island_dem | 25 m DEM for Vancouver Island | UBC PostgreSQL Server |
vancouver_island_boundary | Vancouver Island boundary polygon | UBC PostgreSQL Server |
dams | Dam structures on Vancouver Island (polylines) | UBC PostgreSQL Server — BC Government |
| Conservation Units | Chinook, Chum, and Coho salmon conservation units | UBC PostgreSQL Server — Oceans and Fisheries Canada |
| Tool | Purpose |
|---|---|
| QGIS | Exporting the DEM from PostGIS to GeoTiff |
| ArcGIS Pro (Hydrology toolset) | Flow direction, flow accumulation, stream derivation |
| ArcGIS Pro (Network Analyst) | Trace network creation and upstream tracing |
| ArcGIS Pro (Linear Referencing) | Overlaying stream attributes along routes |
Methods
A stream network was derived from the Vancouver Island DEM using flow direction, flow accumulation, and a threshold of 1,000 accumulated cells. Stream segments were converted to routes and stored in a feature dataset. Topology rules were used to identify where dams and the island boundary intersect the stream routes, producing dam junction and ocean junction point layers. Slope gradient and stream order were extracted along routes using linear referencing and combined into a single overlay event table. A trace network was built to identify stream segments reachable from the ocean without crossing a dam. Finally, segments meeting salmon habitat criteria (1st–2nd order, gradient < 20%, ocean-accessible) were extracted as accessible habitat, with the inverse captured as inaccessible habitat.
Outputs
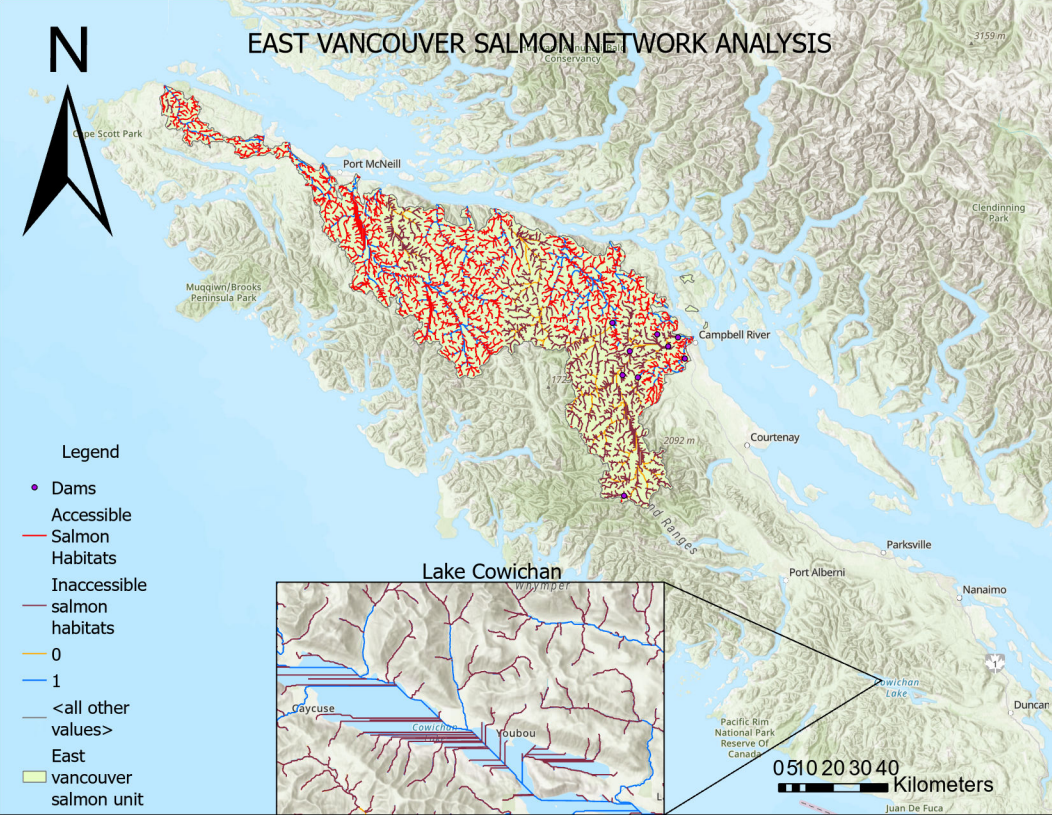
Panel map showing stream routes by reachability, dam barriers, accessible and inaccessible habitat segments, and a zoomed-in view of Lake Cowichan

Summary table of total accessible streams, inaccessible streams, dam junctions, and ocean junctions
Key Findings
- Dams on Vancouver Island significantly fragment the stream network, blocking salmon access to otherwise suitable spawning habitat
- Accessible habitat was concentrated in lower-order streams with gradients below 20%
- The trace network revealed clear upstream limits imposed by dam locations across the conservation unit
Skills Learned
- Deriving stream networks from a DEM using hydrology tools (Flow Direction, Flow Accumulation, Con, Stream Link, Stream Order, Stream to Feature)
- Converting stream features to routes using linear referencing
- Applying geodatabase topology rules to identify feature intersections
- Modelling network barriers using dam and ocean junction points
- Building and tracing a network using the Trace Network toolset
- Overlaying route event tables using dynamic segmentation
- Querying stream segments against multi-condition habitat criteria
- Clipping network results to a conservation unit for final mapping