Overview
This project investigates whether LiDAR-derived structural metrics alone can support dominant tree species classification in the Petawawa Research Forest, Ontario, as part of Ontario's transition to an Enhanced Forest Inventory (EFI). ALS metrics were extracted at ground plot locations, explored for species separability, and evaluated against a classification framework. The analysis focuses on three species — White Pine, Red Pine, and Red Oak — and provides recommendations to the Ontario Ministry of Natural Resources on the operational viability of LiDAR-only species mapping.
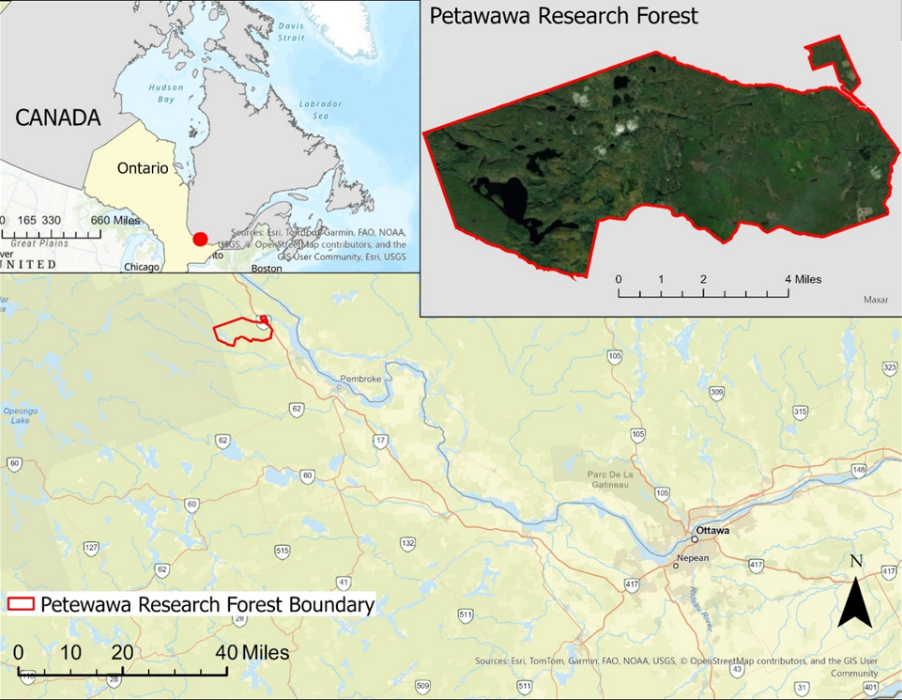
Study site map showing the Petawawa Research Forest boundary in Ontario, Canada
Objectives
- Extract and process LiDAR (ALS) metrics at field plot locations
- Explore species distribution and data quality across the study area
- Identify the most informative ALS features for species classification using mutual information
- Evaluate whether LiDAR alone is sufficient for operational EFI species mapping
- Provide recommendations on integrating multispectral data if needed
Data Sources & Tools
| Layer | Description |
|---|---|
als_metrics.tif | 2018 wall-to-wall ALS metrics raster — 67 bands at 25 m resolution |
plot_locations.gpkg | Ground plot locations across the Petawawa Research Forest |
plot_data.xlsx | Dominant species recorded at each ground plot |
sp_codes.csv | Species name and code lookup table |
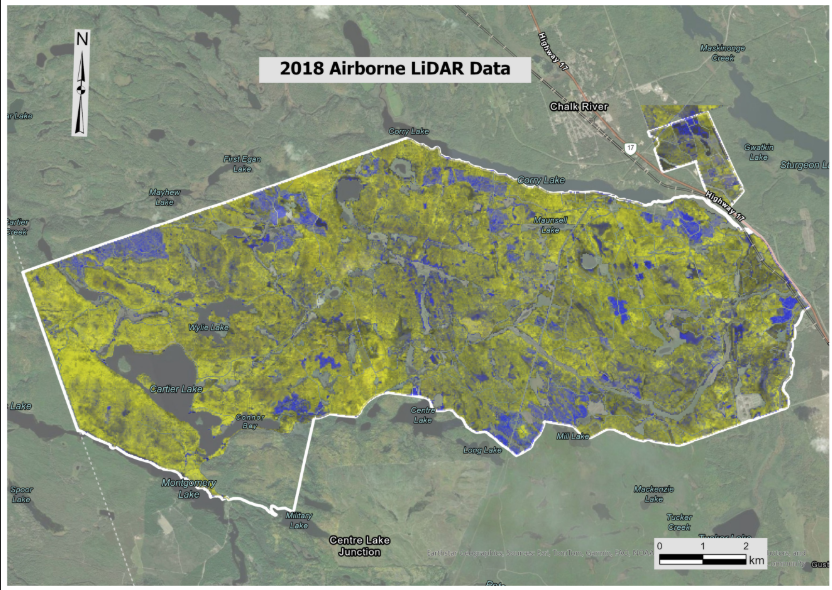
2018 airborne LiDAR data coverage across the Petawawa Research Forest
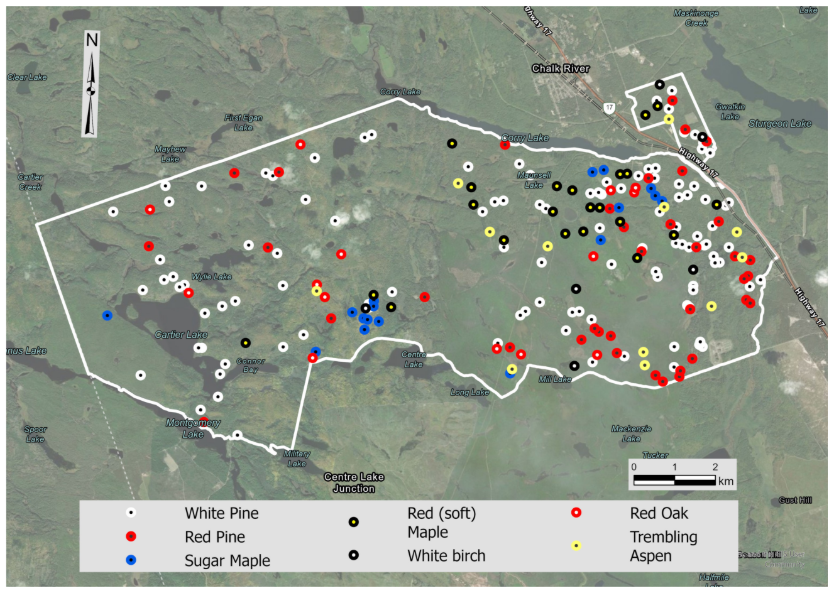
Spatial distribution of dominant tree species across ground plot locations in the study area
| Library | Purpose |
|---|---|
geopandas | Reading and handling spatial plot location data |
pandas | Data wrangling and tabular analysis |
numpy | Numerical operations and array handling |
rasterio | Reading multi-band ALS raster metrics |
matplotlib | Data visualization |
scikit-learn | Mutual information feature selection |
Methods
ALS metrics were extracted at each ground plot location by reading the 67-band raster and aligning it with plot coordinates. Plots with missing LiDAR data were removed. Species with fewer than 15 observations were filtered out, leaving White Pine, Red Pine, and Red Oak for analysis. Mutual information scoring (mutual_info_classif) was used to rank ALS features by their correlation with species class labels. Box plots were generated for the top-ranking features to visually assess class separability. Results were interpreted in the context of EFI operational requirements.
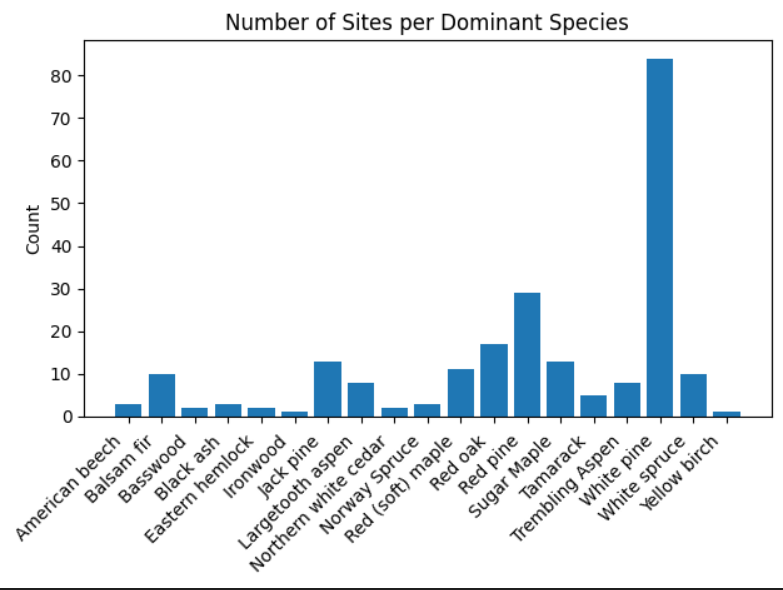
Bar chart showing the number of ground plots per dominant species across the full dataset
For the code used in this analysis, click hereOutputs
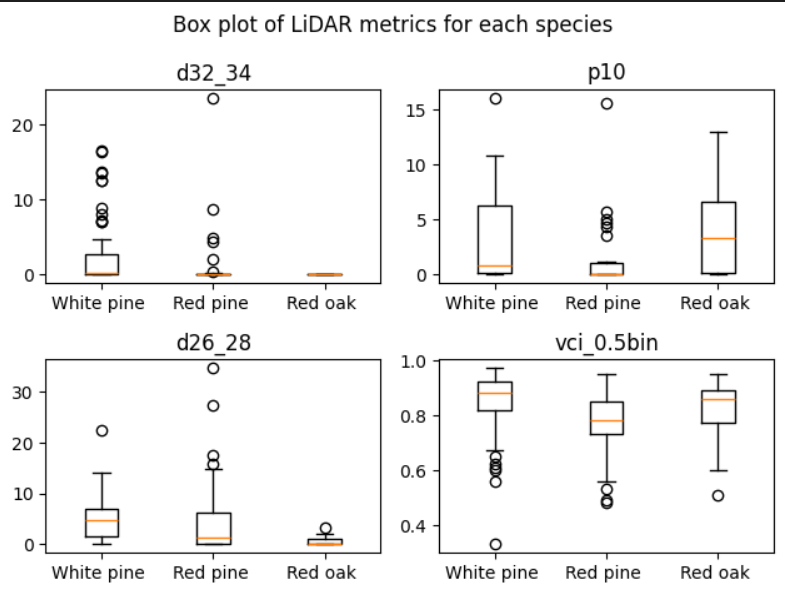
Box plots of top LiDAR metrics (d32_34, p10, d26_28, vci_0.5bin) comparing class distributions across White Pine, Red Pine, and Red Oak
Key Findings
- Many species had insufficient plot observations for robust model training, limiting classification to three species
- Mutual information analysis identified a small subset of ALS metrics with meaningful correlation to dominant species
- LiDAR alone showed limited species separability, suggesting multispectral data integration would improve classification accuracy for an operational EFI workflow
Skills Learned
- Reading and extracting values from multi-band rasters using
rasterio - Spatial data handling with
geopandas - Data cleaning including NaN filtering and class frequency filtering
- Feature selection using mutual information (
scikit-learn) - Visualizing class distributions with box plots and bar charts using
matplotlib - Interpreting LiDAR structural metrics in a forest inventory context